
If you are interested in learning about statistical models and how well they fit the data, you may have come across the term R-square. The R-square formula is a calculation that illustrates how much of the variance in the dependent variable can be accounted for by the model’s independent variables. It can assist you in comparing various models and measuring their effectiveness. In this article, we will explain what the R-square formula is, how to calculate it, how to interpret it, and what its limitations are.
How to calculate R-square formula
The R-square formula is also known as the coefficient of determination. It ranges from 0 to 1, where 0 means no fit and 1 means perfect fit. The formula for R-square is:
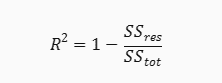
where SSres is the sum of squares of the residuals, and SStot is the total sum of squares.
The residuals are the differences between the dependent variable’s actual and expected values. The sum of squares of the residuals represents the amount of errors in the model.
The total sum of squares estimates the amount of variation in the dependent variable in the absence of any explanatory factors. It is equal to the sum of the residual squares plus the regression squares.
The regression sum of squares calculates how much variance in the dependent variable can be attributed to the model’s independent variables. It is often referred to as the explained variation.
To calculate R-square, you need to find the values of SSres and SStot, and then plug them into the formula. You can use a spreadsheet program or a statistical software to do this.
How to interpret R-square formula
R-square can be interpreted as the proportion of variance in the dependent variable that is explained by the model. For example, if R-square is 0.8, it means that 80% of the variance in the dependent variable can be explained by the independent variables in the model, and 20% remains unexplained.
A graph of R-square shows the relationship between the independent variable and the dependent variable, along with the regression line and the residuals. The R-square value increases as the data points get closer to the regression line.
A higher R-square value indicates a better fit of the model to the data. It means that the model can capture more of the patterns and trends in the data, and make more accurate predictions.
A greater R-square value, however, does not always imply a better model. When utilizing R-square, you should be aware of various limits and drawbacks.
Limitations of R-square formula
- R-square always increases as more variables are added to the model, even if they are not significant or relevant. This can lead to overfitting, where the model becomes too complex and captures noise rather than signal.
- R-square does not indicate whether the model is biased or not. A model can have a high R-square but still produce inaccurate predictions if it is not properly specified or validated.
- R-square does not account for the scale or units of the variables. A model can have a low R-square but still be useful if the variables have small variations or large units.
- R-square does not measure the causal relationship between the variables. A model can have a high R-square but still be spurious if there are confounding factors or omitted variables that affect both the dependent and independent variables.
How Adjusted R-square overcome the limitation of R-square formula
Penalizing for Adding Insignificant Predictors
Adjusted R-squared penalizes the addition of irrelevant predictors, discouraging overfitting and providing a more realistic assessment of the model’s explanatory power.
A More Realistic Measure of Model Fit
By adjusting for the number of predictors, adjusted R-squared offers a better trade-off between model complexity and goodness of fit.